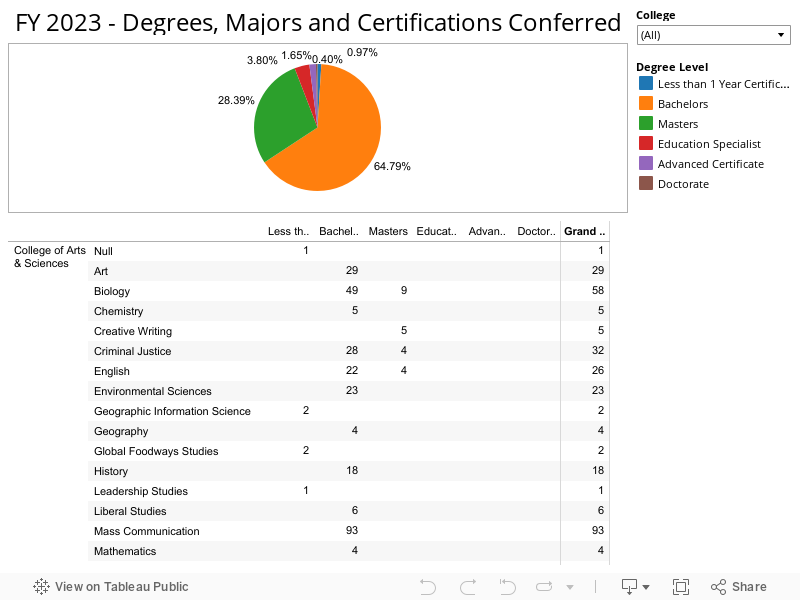
| +/- | College | Major | Less Than One Year Certificate | Bachelor's | Master's | Education Specialist | Advanced Certificate | Doctoral | Total |
|---|
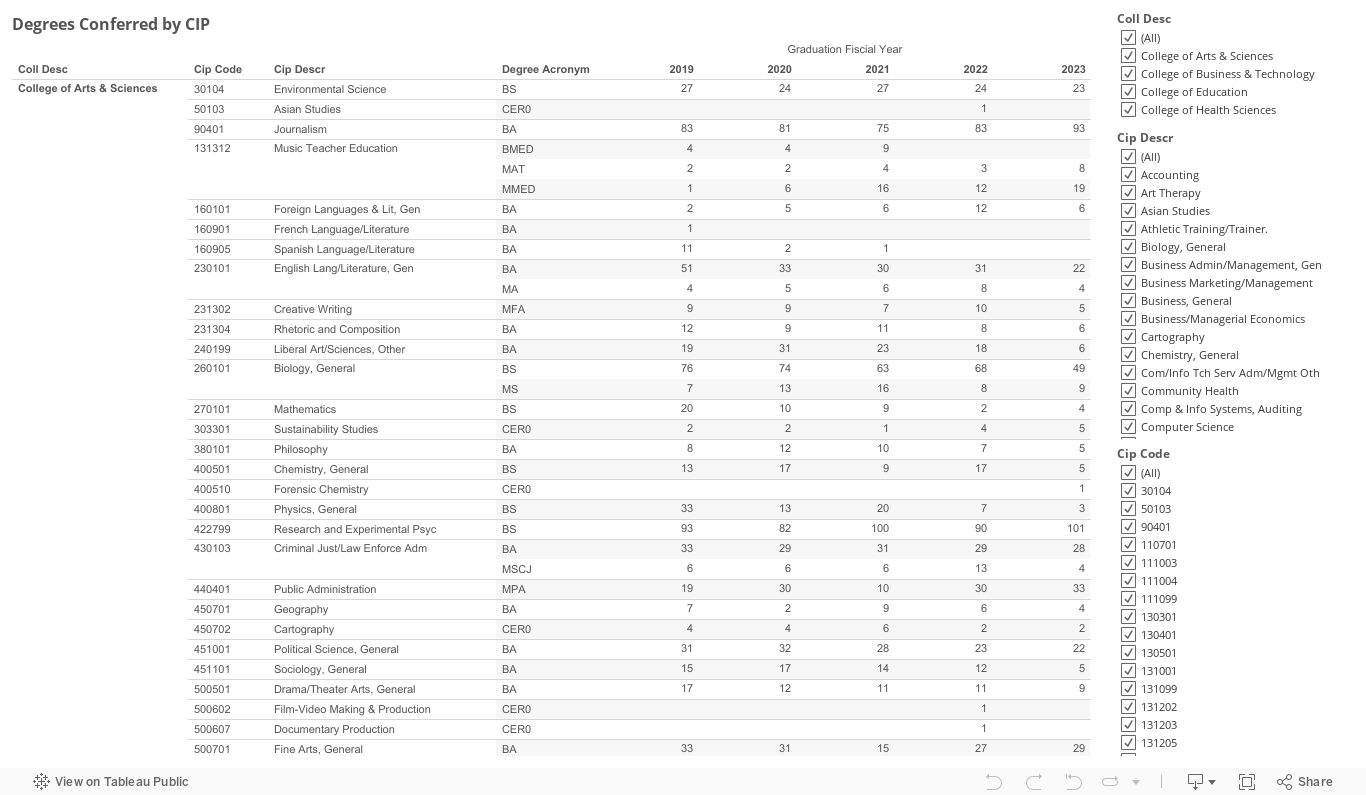
| +/- | College | Degree Level | Major | DEG-MAJR | CIP | Total |
|---|
Degrees Conferred by CIP
| +/- | College | Major | Less Than One Year Certificate | Bachelor's | Master's | Education Specialist | Advanced Certificate | Doctoral | Total |
|---|
| +/- | College | Degree Level | Major | DEG-MAJR | CIP | Total |
|---|