Office of Institutional Research and Effectiveness
Print Quick Facts
Progress - Fall to Fall 2024 Quickfacts
The Quickfact areas below offer a quick glance of Georgia College & State University's progress comparing the current fall to the previous fall.
Enrollment
| GCSU | ||
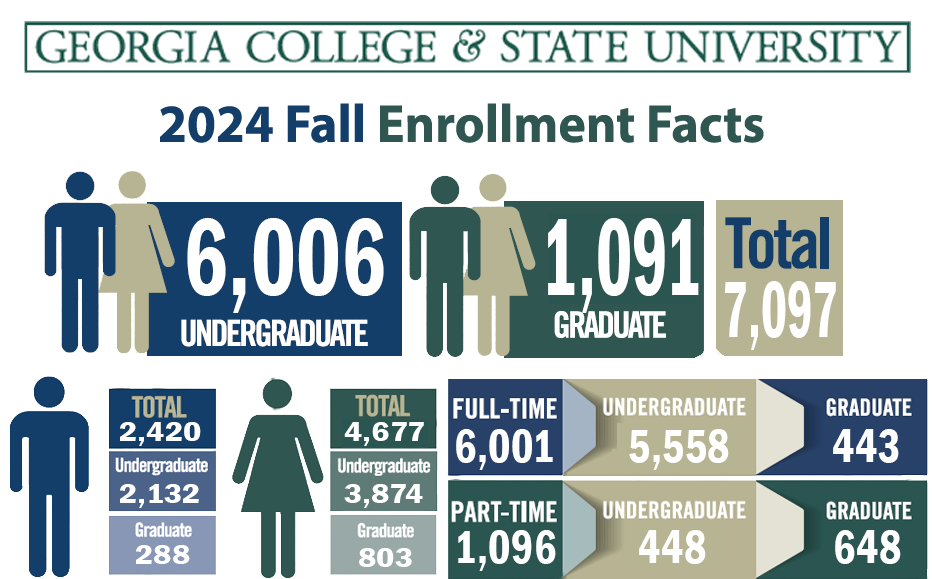
| Total | 7,097 | |
| Male: | 2,420 | |
| Female: | 4,677 | |
| UNDERGRADUATES | ||
| Total | 6,006 | |
| Male: | 2,132 | |
| Female: | 3,874 | |
| Full-Time | 5,558 | |
| Part-Time | 448 | |
| GRADUATE STUDENTS | ||
| Total | 1,091 | |
| Male: | 288 | |
| Female: | 803 | |
| Full-Time | 443 | |
| Part-Time | 648 | |
| CREDIT HOURS GENERATED | ||
| Total | 91,807 | |
Entering Freshmen
| New First-Time Full-Time Enrolled Freshmen | ||
| IPEDS Cohort | 1,796 | |
| *SAT Avg | 1159 | |
| *ACT Avg | 24 | |
| *HS GPA | 3.64 | |
| *Fall Entrants | ||
Retention Rates
| FIRST-TIME FULL-TIME UNDERGRADUATE RATE | ||
| 1YR | 82.35% | |
| 2YR | 70.93% | |
| 3YR | 64.91% | |
| 4YR | 58.25% | |
Graduation Rates
| FIRST-TIME FULL-TIME UNDERGRADUATE RATE | ||
| 3YR | 5.26% | |
| 4YR | 50.15% | |
| 5YR | 59.11% | |
| 6YR | 63.61% | |
| DEGREES CONFERRED | ||
| 2023-24 | 1,718 | |
DATA
The data areas below provide a more detailed look at the reporting areas with added graphs, tables, charts, and dashboards.
Fall 2024 Enrollment by Level
| Academic Level | Student Level | Full-Time | Part-Time | Total |
|---|---|---|---|---|
| Undergraduate | Joint Enrollment | 2 | 34 | 36 |
| Freshman | 1942 | 31 | 1973 | |
| Sophomore | 1503 | 113 | 1616 | |
| Junior | 1086 | 71 | 1157 | |
| Senior | 1010 | 196 | 1206 | |
| Other Undergrad* | 15 | 3 | 18 | |
| Total | 5558 | 448 | 6006 | |
| Graduate | Masters | 394 | 471 | 865 |
| Doctoral Degree | 37 | 29 | 66 | |
| Education Specialist | 11 | 74 | 85 | |
| Other Graduates* | 1 | 74 | 75 | |
| Total | 443 | 648 | 1091 | |
| Grand Total | 6001 | 1096 | 7097 | |
| *Other undergraduates and graduates include transient, non-degree seeking and post-baccalaureate. | ||||
Fall 2023 Credit Hour Production
| College | Lower | Upper | Grad | Total |
|---|---|---|---|---|
| College of Arts & Sciences | 38087 | 9724 | 1109 | 48920 |
| College of Business & Technology | 8272 | 10178 | 1176 | 19626 |
| College of Education | 706 | 2304 | 4036 | 7046 |
| College of Health Sciences | 1797 | 5948 | 1996 | 9741 |
| University-Wide Program | 381 | 0 | 0 | 381 |
| General College | 6069 | 6 | 0 | 6075 |
| University Library | 0 | 18 | 0 | 18 |
| Total | 55312 | 28178 | 8317 | 91807 |
New Freshmen Admissions
Fall Entrance Scores
| Avg High School GPA | |
| Avg SAT | |
| Avg ACT Composite |
Entering Freshmen Gender
New Undergraduate Transfer Students
Admitted and Enrolled Graduate Students
Number of Georgia High Schools our First-Time, Full-Time Freshmen came from
Degrees Awarded 2024
(Summer 2023, Fall 2023, Spring 2024)
| College | Less than 1yr Cert | Bach | Mast | Edu Spec | Adv Cert | Doc | Total |
|---|---|---|---|---|---|---|---|
| College of Arts & Sciences | 15 | 436 | 76 | 0 | 4 | 0 | 531 |
| College of Business & Technology | 37 | 390 | 54 | 0 | 12 | 0 | 493 |
| College of Education | 0 | 67 | 231 | 51 | 1 | 4 | 354 |
| College of Health Sciences | 0 | 244 | 75 | 0 | 14 | 7 | 340 |
| Total | 52 | 1137 | 436 | 51 | 31 | 11 | 1718 |


 2024 Fact Book